
- Home
- Derek's Blog
- DFS Projection System
- Expert League Titles
- Where You've Seen
My Work In The Past - My Most Notable Work
- Original Stats
- DFSEdge Archive
- Contact Derek Carty
Creator of
THE BAT
The Most Sophisticated Projection System
in Daily Fantasy
Expert Leagues
")

")
What Happens When Flyball Hitters Face Flyball Pitchers?
Originally published at DFSEdge.
The concept for my strategy article today is hardly groundbreaking. Some would probably even say it’s obvious. There have been plenty of times in the past, however, that things that are considered obvious or common knowledge turn out to be wrong. Since I’ve been working under certain assumptions in my Strong Plays articles, I thought I’d run some quick numbers today just to confirm that we’re running in the right direction.
When recommending players, I’ll often say something like “Power-hitting Chris Davis is a good bet today against extreme flyball pitcher Phil Hughes.” Of course, this begs questions such as “Do flyball hitters hit even more flyballs against flyball pitchers?” Common sense would tell us that they do, but I wanted to run the numbers to be sure.
To do this, I’ve looked at a recent seven-year stretch of data and identified all of the extreme flyball and groundball hitters and pitchers*, then examined all of the times they faced each other to see if there is any sort of compounding effect. This methodology is far from the most rigorous possible, but it should serve our purposes.
* “Extreme” is an arbitrary concept, so my cutoffs were under 35% or over 55% for groundballs and under 20% or over 35% for flyballs (using Retrosheet batted ball classifications), including all hitters with at least 300 plate appearances and all pitchers with at least 400 batters faced.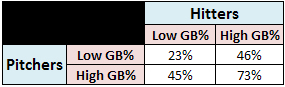
League average groundball rate is about 45%, so as you can see, when hitters and pitchers of opposing approaches meet, they pretty much cancel each other out—no advantage for either the hitter or the pitcher. When a hitter and a pitcher with the same batted ball profile meet, however, the results go absolutely crazy. Pit two extreme groundball players against each other and you’re all but assured of a groundball to occur if contact is made. And, of course, when neither is groundball-inclined, the chance of ants getting killed greatly diminishes. The flyball chart is basically the opposite and shows the exact same thing: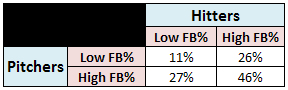
League average flyball rate is about 28%, so while an extreme flyball pitcher and hitter won’t produce a flyball three-quarters of the time like groundballers will, they still combine for a very high rate of balls in the air, which obviously leads to more home runs.
So in this case, the numbers confirm our logic and common sense. That isn’t always the case, but it’s important to get into the habit of checking. There’s nothing worse than things not actually behaving the way you expect them to, and that happens far more often than you’d think in this game.
When recommending players, I’ll often say something like “Power-hitting Chris Davis is a good bet today against extreme flyball pitcher Phil Hughes.” Of course, this begs questions such as “Do flyball hitters hit even more flyballs against flyball pitchers?” Common sense would tell us that they do, but I wanted to run the numbers to be sure.
To do this, I’ve looked at a recent seven-year stretch of data and identified all of the extreme flyball and groundball hitters and pitchers*, then examined all of the times they faced each other to see if there is any sort of compounding effect. This methodology is far from the most rigorous possible, but it should serve our purposes.
* “Extreme” is an arbitrary concept, so my cutoffs were under 35% or over 55% for groundballs and under 20% or over 35% for flyballs (using Retrosheet batted ball classifications), including all hitters with at least 300 plate appearances and all pitchers with at least 400 batters faced.
Groundballs
League average groundball rate is about 45%, so as you can see, when hitters and pitchers of opposing approaches meet, they pretty much cancel each other out—no advantage for either the hitter or the pitcher. When a hitter and a pitcher with the same batted ball profile meet, however, the results go absolutely crazy. Pit two extreme groundball players against each other and you’re all but assured of a groundball to occur if contact is made. And, of course, when neither is groundball-inclined, the chance of ants getting killed greatly diminishes. The flyball chart is basically the opposite and shows the exact same thing:
Flyballs
League average flyball rate is about 28%, so while an extreme flyball pitcher and hitter won’t produce a flyball three-quarters of the time like groundballers will, they still combine for a very high rate of balls in the air, which obviously leads to more home runs.
So in this case, the numbers confirm our logic and common sense. That isn’t always the case, but it’s important to get into the habit of checking. There’s nothing worse than things not actually behaving the way you expect them to, and that happens far more often than you’d think in this game.
Youngest Champion
in LABR History
2009 - NL

Proud Graduate of
the MLB Scouting
Bureau Scout
Development Program
(aka Scout School)
You May
Recognize Me From:
ESPN.com
Baseball Tonight
SportsCenter
Baseball Prospectus
The Hardball Times
NBC's Rotoworld
Sports Illustrated
FOX Sports
USA Today
...or many other places...
Share This Page:
Home | Derek's Blog | Expert League Titles | 2013 Expert League Rosters
Where You've Seen My Work | My Most Notable Work
Original Stats | Scout School Diploma
Contact Derek Carty
Web Site designed and maintained by:
CRD Web Design

Click here to Email CRD Web Design
Click here to visit: CRD Web Design
|
| Share | Tweet |
Home | Derek's Blog | Expert League Titles | 2013 Expert League Rosters
Where You've Seen My Work | My Most Notable Work
Original Stats | Scout School Diploma
Contact Derek Carty
Web Site designed and maintained by:
CRD Web Design
Click here to Email CRD Web Design
Click here to visit: CRD Web Design